Stress Test:
Table of Contents
Building a custom desktop PC, replacing aged thermal paste, or troubleshooting persistent Blue Screen of Death (BSOD) crashes all point to the same critical diagnostic bottleneck: you need to push your system to its absolute operational limits.
A generic computer benchmark or a casual gaming session rarely stresses internal system architecture long enough to uncover hidden physical or logical instability. To guarantee your machine is 100% reliable under heavy multi-threaded development compilations, complex mathematical modeling, or massive rendering workloads, you must perform a structured validation.
This comprehensive technical guide breaks down how to safely execute a complete hardware stress test using entirely free, industry-standard diagnostic tools without risking structural damage to your silicon.
Why a Controlled Stress Test is Mandatory
A standard system stress test forces your central processor, graphics framework, and system memory to run at maximum power draw and 100% processing utilization simultaneously. This intentional load serves two critical diagnostic purposes:
1. Thermal Management & Dissipation Validation
It forces your cooling loops, fans, and thermal interface materials (TIM) to handle peak heat generation. If your CPU temperatures immediately spike past safe parameters upon initiating a load, it points to localized contact issues, poor thermal paste application, or pump failures inside your cooler.
2. Voltage Rail and Logic Stability Verification
It verifies whether your Power Supply Unit (PSU) and motherboard Voltage Regulator Modules (VRMs) can deliver clean, continuous electrical current under peak power draws. Modern hardware components draw vast amounts of power in sudden bursts (transient spikes). A controlled test ensures your system does not trip overcurrent protection (OCP) systems during intense calculations.
The Tiered Blueprint: Stress Testing Each Component
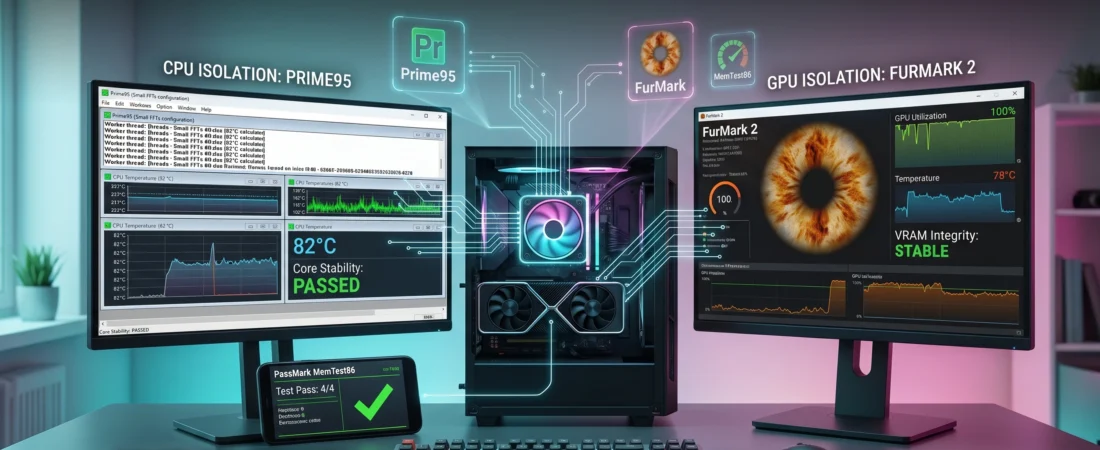
To properly isolate system instability, you should never test every hardware component at once right out of the gate. If the machine crashes under a combined global load, you cannot easily identify the true root cause. Instead, deploy a structured, component-by-component isolation testing framework using specialized open-source utilities.
[System Load Testing Sequence]
│
├──► 1. CPU ISOLATION (Prime95 Small FFTs) ──► Target: Thermal & Core Voltage Bounds
│
├──► 2. GPU ISOLATION (FurMark 2 Vulkan) ──► Target: VRAM Leakage & Transient PSU Spikes
│
└──► 3. RAM ISOLATION (MemTest86 Bootable) ──► Target: Physical Bit-Flips & Timing Errors
1. The Processor Check: Prime95
When it comes to pure mathematical calculations that push silicon execution units to their absolute limits, Prime95 remains the definitive tool. It works by forcing the processor to calculate complex prime numbers using Fast Fourier Transforms (FFTs), stressing the arithmetic logic units (ALUs) and floating-point units (FPUs).
Step-by-Step Configuration Strategy:
- Download the latest deployment files from the Official Prime95 Home Server.
- Launch the application and select “Just Stress Testing” when prompted.
- In the execution window, select the Small FFTs configuration profile. This specific mode keeps the calculation data data size small enough to fit entirely within your processor’s high-speed L1, L2, and L3 cache pools. This forces the CPU cores to loop continuously without pausing to wait for external system RAM, generating maximum heat output.
What to Monitor:
Keep HWiNFO64 Diagnostic Tools open on a secondary screen while running the execution workers.
- Thermal Throttling Flags: Watch the core temperatures carefully. If the processor hits its hardcoded thermal ceiling (typically 90°C to 100°C depending on modern architecture rules), the internal clock speeds will drop to prevent damage.
- Worker Thread Failure: If a specific Prime95 worker window displays a “Rounding error occurred” notification or terminates completely while the other threads keep running, your CPU core voltage calculation is unstable.
2. The Graphics Arena: FurMark 2
To push your graphics card’s compute blocks, internal power distribution lines, and onboard high-bandwidth video memory (VRAM) to their physical maximum thresholds, use FurMark 2.
Step-by-Step Configuration Strategy:
- Download the updated utility package via the Official Geeks3D FurMark 2 Portal.
- Open the control console and configure your test to match your display monitor’s native resolution.
- Select the graphics API layer you want to test. For modern Windows 11 architectures, running the Vulkan or DirectX 12 API profiles yields the most accurate power delivery stress metrics.
- Click the dedicated GPU Stress Test launcher to initiate the continuous donut rendering pass.
What to Monitor:
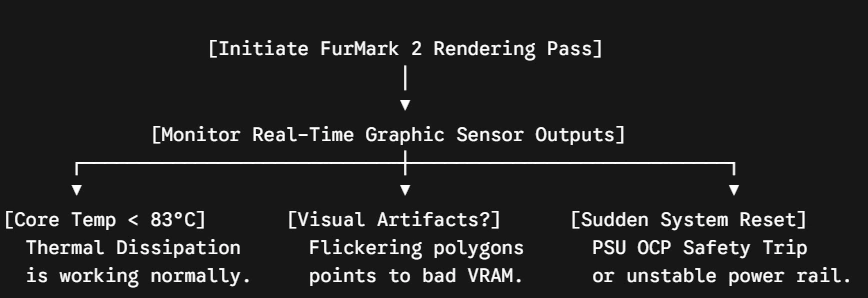
- Visual Artifacts: Watch for flashing pixels, neon lines, or stray geometric polygons popping up on screen. These visual anomalies indicate your VRAM modules are unstable, or overheating.
- System Hard Resets: If your PC suddenly shuts off completely or reboots without warning, it usually indicates your Power Supply Unit cannot handle the load, or your motherboard’s VRMs are failing under sustained current draw.
3. The System Memory Scan: PassMark MemTest86
Random system crashes, corrupted project files, and unprovoked desktop app failures are frequently caused by failing memory modules or unstable timing configurations in the system BIOS. Traditional desktop-based memory diagnostic applications cannot access memory areas occupied by the operating system itself. Therefore, a pre-boot testing environment is mandatory.
Step-by-Step Configuration Strategy:
- Download the free tier builder image from the Official PassMark MemTest86 Portal.
- Insert a spare USB flash drive and use the included tool to flash a secure, self-booting image onto the drive.
- Restart your computer, enter your motherboard boot menu selection screen (typically hitting F8, F11, or F12 at system startup), and select the USB drive as your primary boot source.
- The system will bypass Windows completely, launching the UEFI memory diagnostics interface.
What to Monitor:
Let the program execute its full structural automated testing pattern, which consists of 14 distinct testing algorithms (including row-hammer error detection). It writes explicit blocks of binary data into every memory location before reading them back to check for variations.
- The Error Counter: A stable system must return zero errors across all passes. If even a single address block turns red or registers an error, your memory timing configurations are mismatched, your memory voltage is insufficient, or a physical RAM stick has failed.
System Evaluation Protocol Summary Matrix
The following table provides the operational thresholds, target software profiles, and standard verification durations for conducting a controlled hardware analysis.
| Tested Hardware Tier | Recommended Free Software Utility | Critical Thermal Ceiling | Minimum Recommended Duration |
| CPU Core Computing | Prime95 (Small FFTs Mode) | Keep Under 85°C | 30 to 60 Minutes |
| Graphics Core & Power | Geeks3D FurMark 2 (Native API) | Keep Under 83°C | 20 to 30 Minutes |
| System Memory (RAM) | PassMark MemTest86 (UEFI Boot) | Digital Pass / Fail | Complete 4-Pass Cycle |
Some Other GeekMatrex Posts:
- How to Clear NVMe SSD Cache Windows 11: Restore Maximum Speed
- Network Optimization: The Ultimate Guide to Improving PC Speed and Stability in 2026
- Stress Test: How to Check PC Hardware Stability with Free Software 2026
- Quadro P620 Gaming Performance & Windows 11 Drivers: The Optimization Guide
- Apps for Computer: Top 10 Must-Have PC Software Programs for 2026